See where your stock went, and what it cost
Every count is compared against what you should have used, so the gap shows up as a number you can act on. You see where and how much, by item and by branch, before it quietly eats your margin.
Keep your POS · works offline · staff never see prices
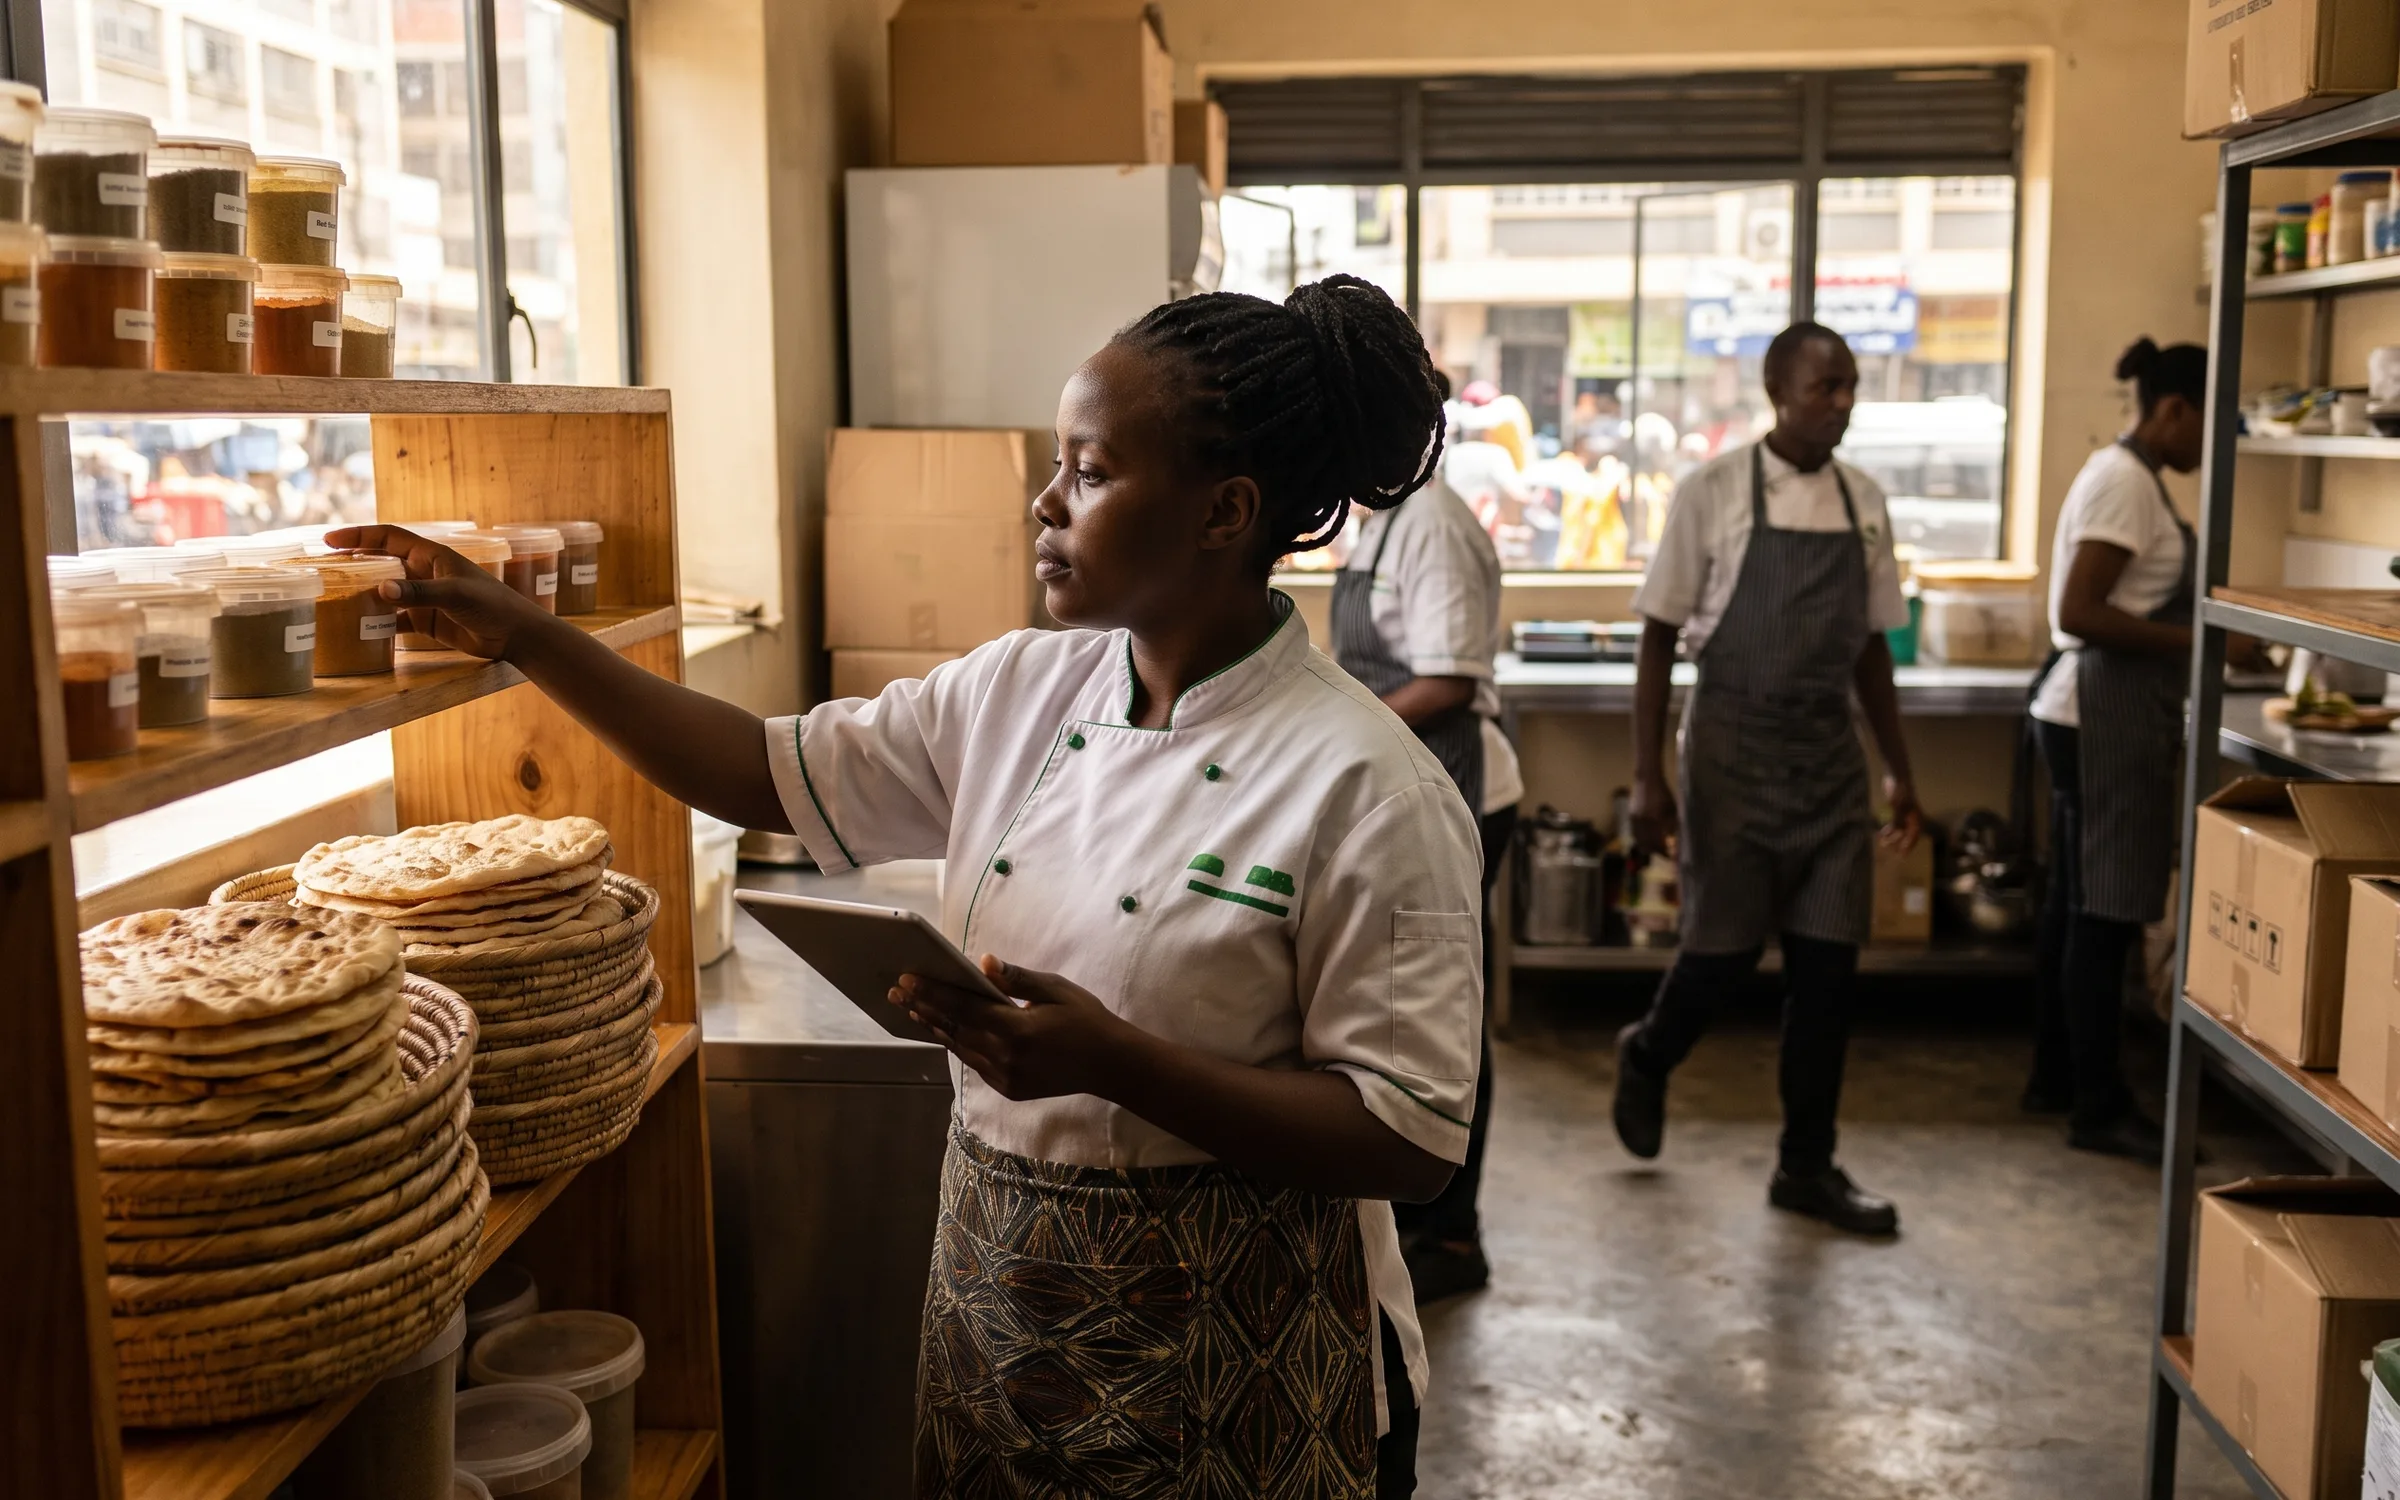
Sales reports tell you what left the till, never what left the store. Portioning drift, spoilage and miscounts hide inside a single food-cost percentage until the month is already gone.
Expected vs actual, by item
harakacount deducts recipes and deliveries to build an expected usage, then compares it to your real count. The variance shows per item, not buried in one blended number.
Broken down by branch
Filter the same variance by location to see which kitchen is drifting and which is tight, and compare like for like across the group.
Priced at what you actually paid
Each gap is costed on your real FIFO purchase price, so a small variance on an expensive item is flagged ahead of a large one on something cheap.
See it in the app
Stop guessing where the margin goes
See your own variance, by item and branch, in a short walkthrough with our team.
Keep your POS · works offline · staff never see prices